
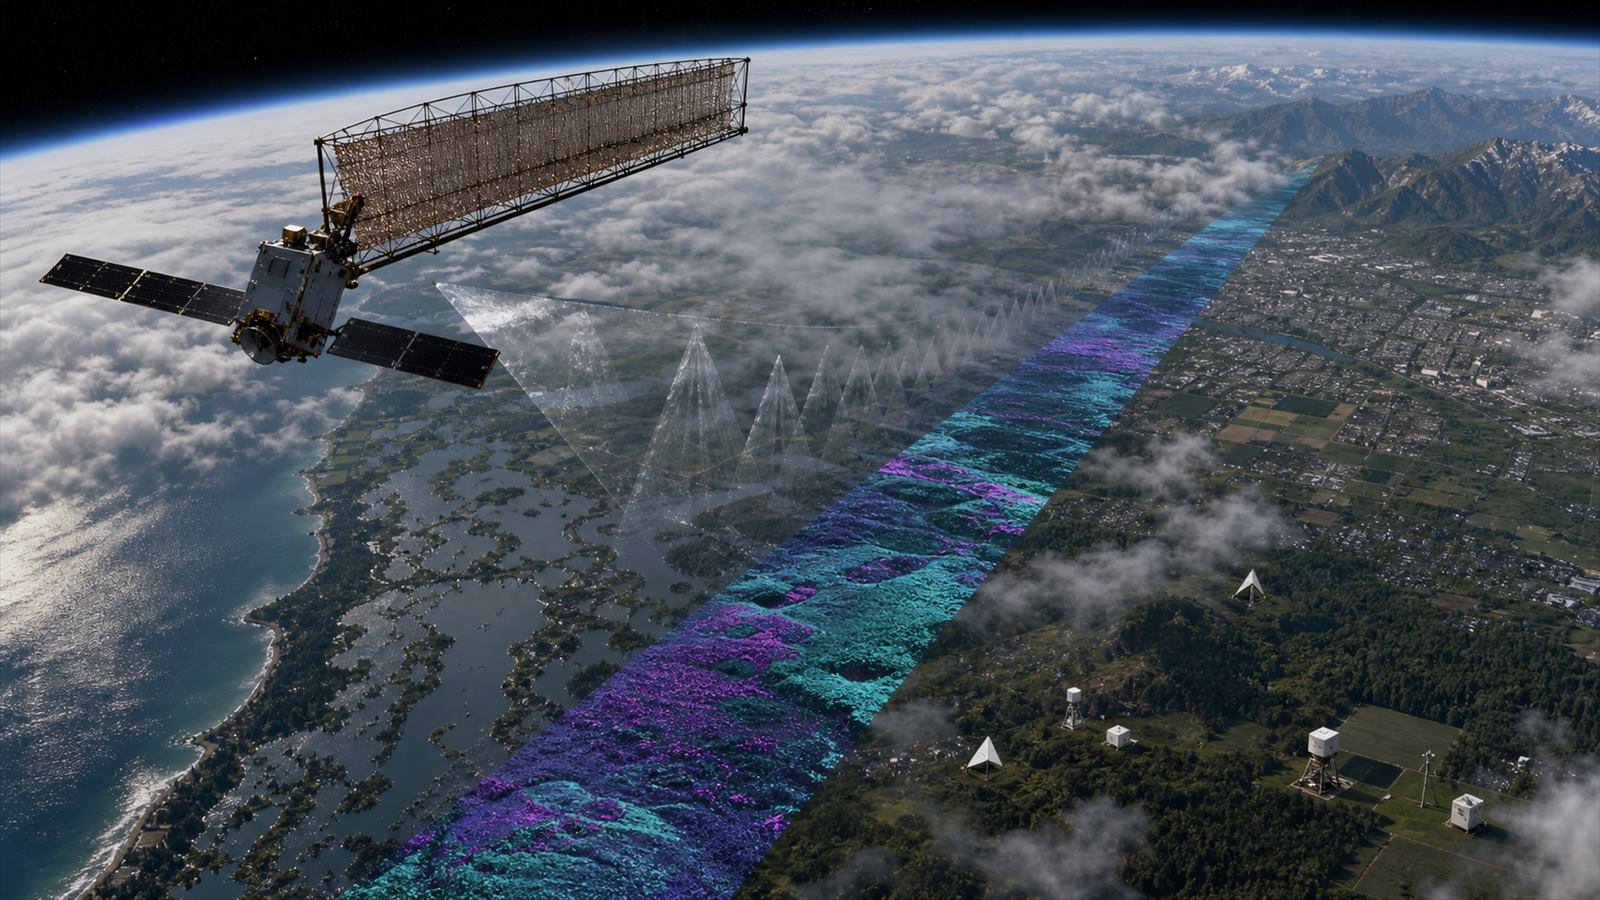
Optical satellites show Earth in familiar colors, but clouds and darkness can hide the events that matter most. Synthetic aperture radar, or SAR, takes a different approach. It sends microwave pulses toward the surface and measures the returning signal, allowing satellites to collect data day or night and through most cloud cover.
That capability makes radar valuable for floods, sea ice, earthquakes, volcanoes, forests, agriculture, and infrastructure. Yet a radar image is not a transparent photograph of reality. Wavelength, polarization, viewing geometry, surface roughness, moisture, processing choices, and reference measurements all shape what the data means.
A moving antenna creates a much larger virtual aperture
Radar resolution normally improves with a larger antenna. A spacecraft cannot carry an antenna hundreds of meters long, so SAR uses motion and signal processing. As the satellite moves along its orbit, it observes the same area from many successive positions. The changing phase and Doppler history of the returned signals are combined to synthesize the performance of a much longer antenna.
The instrument is usually side-looking rather than pointed straight down. The travel time of a pulse helps locate features across the flight path, while the synthetic aperture improves detail along the path. Precise knowledge of the spacecraft’s position and motion is essential because small errors can blur the reconstruction.
This is one reason Earth observation is more than putting a camera on a small spacecraft. Our overview of small satellites and Earth observation explains how calibration, coverage, data handling, and continuity decide whether measurements become a dependable service.
Radar sees physical scattering, not visible color
A SAR pixel records the strength and phase of microwave energy scattered back toward the antenna. Smooth water often reflects energy away and appears dark, while rough surfaces or structures can return a stronger signal. Vegetation, soil moisture, buildings, snow, ice, and surface orientation produce different patterns.
Wavelength changes what the instrument interacts with. Longer wavelengths can penetrate further into vegetation or dry surface material than shorter ones, but penetration is not unlimited and depends on the target. Polarization, the orientation of the transmitted and received electric fields, provides another way to separate scattering mechanisms.
False-color radar products combine channels or acquisition dates to make differences visible. Their colors are analytical choices, not the colors a person would see from orbit. Interpreting a bright or dark area requires knowledge of the sensor mode and local conditions.
Cloud penetration has important limits
Microwave wavelengths used by many spaceborne SAR systems pass through clouds and do not require sunlight. That supports imaging during storms and at night, when optical sensors may have no usable view. The European Space Agency’s Sentinel-1 mission uses C-band radar for all-weather, day-and-night observations across maritime, ice, land-motion, environmental, and emergency applications.
All-weather does not mean unaffected by the atmosphere. Heavy precipitation can influence some radar bands, and water on vegetation or the ground can change backscatter. The sensor also does not simply see through buildings, solid rock, or dense material. Different wavelengths respond to different depths and structures.
Radar geometry creates its own blind spots. Mountains can block the beam and cast radar shadow. Slopes facing the sensor can appear compressed, while steep terrain may fold over in an effect called layover. Multiple viewing directions or a terrain model may be needed to interpret complex landscapes.
Interferometry measures change through phase
When a satellite observes the same area from nearly the same geometry at different times, analysts can compare the phase of the returned signals. Interferometric SAR, or InSAR, can reveal small changes in distance between the ground and satellite. It is used to study earthquake deformation, volcanic inflation, subsidence, landslides, glacier motion, and changes around infrastructure.
The measurement is indirect. Orbital separation, topography, atmospheric water vapor, vegetation change, snow, and processing errors can all affect phase. If the surface changes too much between acquisitions, the signals lose coherence and a clean comparison may not be possible.
Analysts therefore use precise orbit data, elevation models, atmospheric corrections, time series, and independent instruments. A striking interferogram is the beginning of interpretation, not automatic proof of the cause.
NISAR adds two radar wavelengths to an active global mission
The NASA-ISRO Synthetic Aperture Radar mission launched in July 2025 and is now listed by NASA as an active science mission. NASA’s current NISAR mission page identifies an L-band radar with a 24-centimeter wavelength and an S-band radar with a 9.4-centimeter wavelength. The combination supports measurements of land, ice, water, vegetation, and surface change.
NASA says provisional L-band products released in July 2026 are calibrated but have been validated at a limited number of sites. That wording matters. Provisional data can be scientifically useful while calibration and validation continue; users should read product documentation rather than assuming every value has final status.
Sentinel-1 provides a complementary operational example. ESA says Sentinel-1C and Sentinel-1D now continue the C-band mission, with global coverage, rapid delivery, and an integrated ship-identification capability. Different missions, bands, modes, revisit schedules, and viewing geometries can strengthen analysis when their data is combined carefully.
Ground truth turns radar signals into usable measurements
Calibration sites use targets with known radar responses, including carefully surveyed corner reflectors and electronic transponders. Engineers compare measured position and brightness with expected values to identify geometric or radiometric bias. Stable natural targets can also help track instrument behavior over time.
Application validation needs local evidence. Flood maps can be compared with gauges, aerial observations, and field reports. Crop or forest products need plots and measurements on the ground. Deformation estimates can be compared with Global Navigation Satellite System stations, leveling surveys, or other geodetic instruments.
Ground truth is not a sign that satellite data failed. It is how a remote measurement is connected to a physical quantity, its uncertainty, and the conditions under which a model remains valid.
Data infrastructure is part of the instrument
SAR processing turns raw echoes into focused images, calibrated products, terrain-corrected maps, interferograms, and time series. Each step requires metadata, precise orbits, processing software, storage, and quality control. Large-area, frequent observations can create more data than users can download and process locally.
Cloud platforms increasingly bring analysis to the archive, but reproducibility still requires product versions, processing parameters, code, and reference datasets. The same issue appears in other survey missions: our article on SPHEREx as data infrastructure explains why calibration and archives are part of a telescope’s scientific output.
Downlink capacity and delivery latency also shape emergency value. Optical relay networks may eventually move more Earth-observation data quickly; our guide to space laser communications covers the networking challenge. A rapid flood map is useful only if observations, processing, and distribution all arrive in time.
How to read a radar-based claim
Look for the satellite and sensor band, acquisition date, viewing direction, polarization, resolution, processing level, and whether the product uses one image or a time series. Ask what was measured directly, what was inferred by a model, and how the result was validated.
For change maps, check the reference period, coherence, atmospheric correction, terrain handling, and uncertainty. For classification products, ask which ground observations trained or tested the method and whether the landscape matches the training region. A high-resolution image can still support a weak conclusion if the interpretation is not validated.
What to watch next
The important developments are validated NISAR science products, continued Sentinel-1C and -1D operations, more accessible time-series processing, cross-mission calibration, and faster disaster-response pipelines. Open data will help only when documentation and computing tools make comparisons reproducible.
SAR’s real strength is reliable measurement under conditions that defeat ordinary imaging. Its signals can reveal water, motion, structure, and change through clouds and darkness, but expertise and ground evidence turn those signals into knowledge.
Leave a Reply